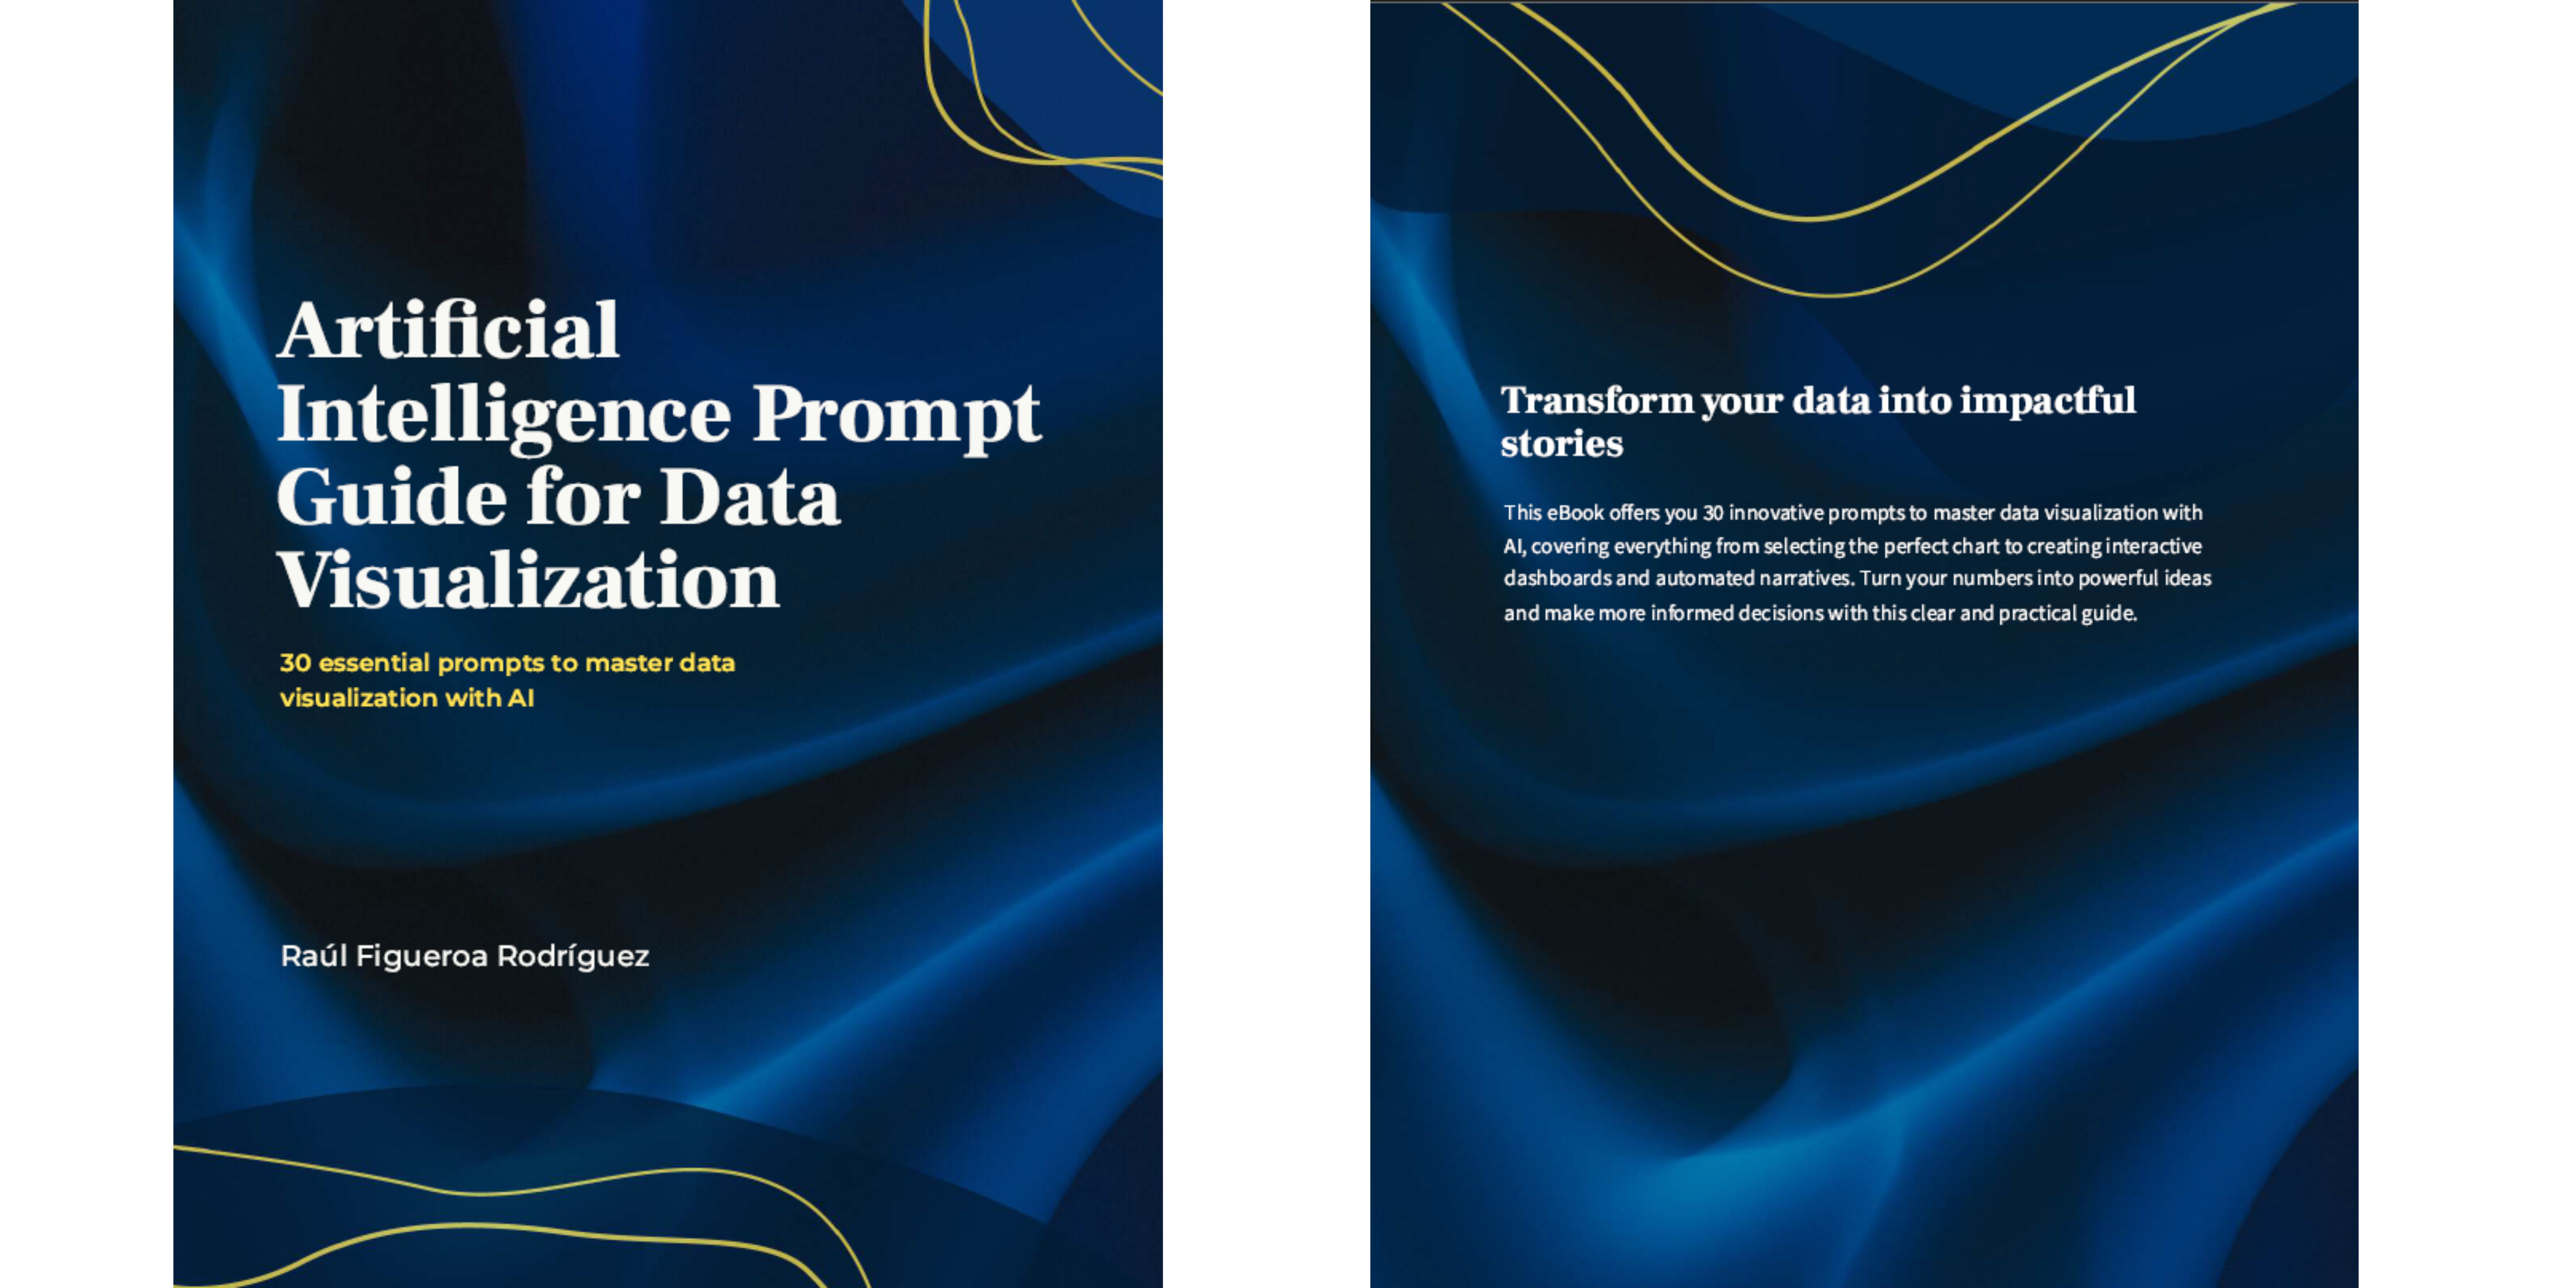
Artificial Intelligence Prompt Guide for Data Visualization
Transform your presentations from mundane to mesmerizing with our ebook: Artificial Intelligence Prompt Guide for Data Visualization. This guide features 30 essential prompts that help you choose the right charts, colors, and techniques to clean messy data. It also aids in creating engaging narratives for your audience, among other things. Don’t struggle—master storytelling with data today. Elevate your presentations, captivate your audience, and become the speaker everyone remembers. Secure your guide now and shine on stage!

Raúl Figueroa Rodríguez
Documentos, cursos y webinars sobre asuntos relacionados a visualización de datos y demografía. Más de 20 años de experiencia como consultor en demografía y visualización de datos.
What You'll Get:
Are you struggling to decide which chart to use or how to clean your data before visualizing it? Do you want to create interactive dashboards and tell stories with clear, compelling information? This eBook is your solution. We’ve gathered 30 prompts that will help you:
• Choose the ideal chart type for each project.
• Clean and prepare your data to achieve accurate representations.
• Develop interactive dashboards with filters and detailed analyses.
• Master advanced techniques (time series, geospatial maps, dynamic infographics, scrollytelling).
• Apply brand guidelines and professional design standards to your visualizations.
• Generate data narratives and automated conclusions using AI.
• Understand and visualize the interpretability of machine learning models (SHAP, LIME) and their impact.
Whether you’re a beginner seeking to learn visualization basics or a professional wanting to elevate the quality of your presentations, this guide will take you step by step through each challenge. Turn your numbers into engaging stories and make smarter decisions with clear, effective visualizations. Let your data speak for itself!
- 1 Files
-
ai-prompt-guide-for-data-visualization v2.pdf
451.9 kB -
40 pages (~5,225 words)


